"Smart Growth" and "New Urbanism" Compared with "Large Lot Zoning" (Tom Lane) [ Home Page – Click Here]
(May 17, 2017) – Traditional "Large Lot Zoning" is "Greener" than "Smart Growth" within Urban Growth Boundaries . . . Copyright 2009 – 2017 . . . Tom Lane . . . Photographing California, Arizona, Nevada, New Mexico, Colorado, Utah, Oregon, and Seattle, Washington.
(December 8, 2011) Why Seattle’s Anti-Toll, Anti-Transit Initiative 1125 Didn’t Pass
(December 8, 2011, Tom Lane) The photo above shows the Interstate 90 bridge over Lake Washington, where light rail is planned, between Seattle skyscrapers on the left, and Bellevue skyscrapers on the right. This is looking WNW from The Golf Club at Newcastle, located a few miles southeast of Bellevue and approx. 10 miles east of Seattle.
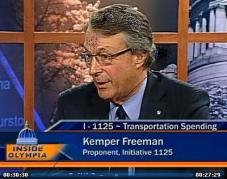
Initiative 1125, submitted to Seattle and Washington State voters in November 2011, by sponsors Tim Eyman and Kemper Freeman, would have passed overwhelmingly statewide, if not for what opponents said.
1125 lost statewide, with 53% voting no, and 47% voting yes. Click here for an article in the Nov. 10, 2011 Seattle Times discusses the election results.
I-1125 would have banned mass transit (light rail) on Interstate 90, between Seattle and Bellevue.
In addition, Initiative 1125 would have banned congestion pricing (i.e. higher tolls during the Seattle area commute, a “regressive” way to tax the poor and middle classes). And, I-1125 would have also banned several other factors that lead to “regressive” tolling practices on the middle class in the Seattle metro area, similar to regressive taxes (outlined in the poll results, below).
Tom Lane’s Other Posts on I-1125, Light Rail, and Kemper Freeman
Before proceeding, click the following link for a list of all of my posts. (Posts and Photos Copyright 2010-2011, Tom Lane, except the Video screenshots from Firefox, with appropriate credit provided.)
https://smartgrowthusa.wordpress.com/category/light-rail/
Second, please click this link, for my I-1125 You Tube Video page.
Third, for my letter to public officials advocating a yes vote on 1125, click this final link. Note: Neither the 2nd or 3rd link appears in the first link above.
Post-Election Poll Results from Tim Eyman and KING-5-TV
Tim Eyman and KING-5 Television conducted a poll after the election on November 15, 2011 (reprinted below). After the election, Eyman found that voters overwhelmingly supported four out of five provisions of I-1125. However, the fifth provision, that would have delegated the Legislature to set tolls – instead of the State Transportation Commission – was heavily opposed (survey results below).
Tim Eyman explains in a recent email to his supporters (reprinted below), that the opposition to Initiative 1125, focused their advertising campaign on a this very controversial provision of 1125:
“The poll results from November 15th reinforce what we wrote on November 10th: I-1125 opponents’ focused their $2.5 million on one provision of I-1125: the requirement that the Legislature, not the Transportation Commission, set tolls.
Observation: if that provision hadn’t been included, given the closeness of the election, I-1125 probably would have been approved by voters.”
Unfortunately, the I-1125 opponents of 1125 succeeded, and I-1125 lost – yet it was close, losing by only 100,000 votes in Washington state.
However, Most of Washington State Did Not Buy the Opponents’ Rhetoric
Most of Washington State’s counties didn’t buy the rhetoric from the opposition, and voted for 1125.
If not for Seattle, Everett, Olympia, Bellingham, and other “liberal cities,” then Initiative 1125 would have passed statewide, since Washington is a very fiscally conservative, anti-tax state, outside of the liberal major metro areas.
However, I-1125 passed overwhelmingly in Clark County, home of Vancouver, Washington next to liberal Portland, Oregon, with 59% voting yes. The above linked Seattle Times article quotes a “no on 1125 campaign spokesperson.” He says that the no campaign didn’t campaign against 1125 in Clark County, due to the extra expenses of buying advertising in the Portland media market.
Map from Washington State Secretary of State.
Click This Link for an interactive map, for voting results for each county:

November, 2011 I-1125 Screenshot of Election Results for Washington State from the Secretary of State, with the mouse hovering over King County (Seattle-Bellevue).
Tim Eyman Post Election Poll Questions
(Results appear below.)
1. If a toll is collected to pay for a particular project, once that project is paid for, should the toll remain in place? Or should the toll be eliminated?
2. If a toll is collected on one roadway, should the state be allowed to use the money to pay for another roadway? Or only allowed to use the money on the road where the toll is collected?
3. Should the state be allowed to use money collected from tolls to pay for bicycle, pedestrian, and transit improvements? Or, should money from tolls only be used for highway purposes?
4. Do you prefer a uniform toll at all times of the day? Or do you prefer congestion pricing (variable tolling), where the toll is higher at some times and lower at other times?
5. Who should set tolls? The legislature? Or the transportation commission?
Tim Eyman Email to His Supporters and I-1125 Poll Results
Monday, November 28th, 2011
To: Our thousands of supporters throughout the state (cc’d to the media, house & senate members, and Governor)
RE: New poll shows that the campaign for I-1125 solidified support for several of its policies
Our tolling initiative — I-1125 — contained several major policies. In September, KING 5 did a poll on each one. We wanted to find out what the results were now.
Below are the results of this post-election poll (we’ve included the KING 5 results so you can see a side-by-side comparison — the wording of the questions was identical).
The poll results from November 15th reinforce what we wrote on November 10th: I-1125 opponents’ focused their $2.5 million on one provision of I-1125: the requirement that the Legislature, not the Transportation Commission, set tolls.
Observation: if that provision hadn’t been included, given the closeness of the election, I-1125 probably would have been approved by voters.
Politicians are in for a rude awakening if they implement policies the people strongly oppose by claiming “the voters told us they wanted us to do it — look at the vote on I-1125.” And thanks to the campaign for I-1125, those efforts will receive much more public scrutiny.
Our state is about to jump off a big cliff when it comes to tolling. Thanks to the campaign for I-1125, we put a very bright spotlight on this critical issue, forcing state and local politicians to engage in a very public debate and discussion. It would be political suicide for public officials to ignore the citizens’ strong views about tolls and tolling policy as they move forward.
Nearly 900,000 voters voted yes on I-1125 (meaning they supported all of its policies). Nearly a million voters voted no. With the margin that close and the new polling so lopsided, politicians are signing their own political death warrants if they bulldoze ahead without implementing many of I-1125’s policies.
And if they have any hope of convincing voters to vote yes on their new multi-billion-dollar transportation tax package, they had better provide several of I-1125’s protections first. With tolling, politicians are walking on the thinnest of thin ice. Best regards, -Tim Eyman
Summary of Poll Results, Eyman Nov. 2011 vs. KING-5-TV Sept. 2011
This Microsoft Word document was attached to Eyman’s email. At the end of this post is a more detailed EXCEL chart with additional demographic variables. Note that all four provisions of I-1125 were heavily opposed except for delegating tolls to the Legislature.
The first “column” are Eyman’s November 15, 2011 poll results, after the election. The second “column” are KING-5-TV’s poll results, with identical questions, before the election on Sept. 23, 2011.
PLEASE CLICK TO ENLARGE to Read Eyman / KING-5-TV Survey –
KING-5-TV Poll on Congestion Pricing (Variable Tolls) on SR-520
SR-520 runs between Seattle and Bellevue, parallel to I-90. KING-5-TV in a January, 2011 poll found that most drivers will avoid 520 with congestion pricing. Among other questions, the survey asked:
“The tolls will range from $3.50 during peak hours, between $1.10 to $2.80 during off-peak hours and no toll overnight between 11 p.m. and 5. a.m. Once the toll begins, will you avoid 520 altogether? Will you reduce your use of 520? Or would tolls have no effect on how often you use 520?”
The results on the SR-520 poll are here:
http://www.surveyusa.com/client/PollReport.aspx?g=0bfb78c0-b703-4b7c-8f45-619a5e792faf
PDF Equivalent:
http://www.surveyusa.com/client/PollPrint.aspx?g=0bfb78c0-b703-4b7c-8f45-619a5e792faf&d=0
Here is SR-520 between Seattle and Bellevue , with only 4 lanes across Lake Washington. The State plans to build a new 6 lane bridge. However, Kemper Freeman’s engineers recommended a new 8 lane bridge.

SR-520 between Seattle and Bellevue, 4 lanes across Lake Washington. The State plans to build a new 6 lane bridge. However, Kemper Freeman's engineers recommened a new 8 lane bridge.
KING-5-TV Poll on Tolling I-5 Express Lanes through Seattle
Again, respondents are opposed to tolls on Interstate 5 express lanes through Seattle. Results:
http://www.surveyusa.com/client/PollReport.aspx?g=91f1f8fd-844c-425e-8cb4-ea07ecc13ef1
PDF Equivalent:
http://www.surveyusa.com/client/PollReport_left.aspx?g=91f1f8fd-844c-425e-8cb4-ea07ecc13ef1#
Unresolved Issues due to Rejection of 1125
On my other Seattle-Bellevue light rail pages, you’ll read why light rail in the Seattle area will only take 1% to 3% of all vehicle trips by 2040, even with mass transit on I-90. How will that solve the region’s horrible traffic problems?
Clearly, new approaches are needed, such as bus rapid transit, bicycling, and more freeway lanes. Unfortunately, the Puget Sound Regional Council and Sound Transit continue to advocate for more light rail, with inadequate attention to more freeway lanes.
The end result will be escalating gridlock, especially when the most recent ACS U.S. Census results show that billions spent on light rail in 50 years, has not changed the proportion of individuals riding light rail (see chart) –
 John Niles, of Global Telematics in Seattle, reports that the number of light rail passengers has continuously failed to meet ridership goals of Sound Transit in Seattle.
Furthermore, millions of dollars in smart growth studies in University Urban Planning Departments are not convincing Americans to move into downtown smart growth towers with no private yards.
Indeed, Joel Kotkin of Forbes reports recent census data, showing that during the 2000’s, less population growth occurred in downtown areas, than in the 1990’s:
“During the 2000s, the Census shows, just 8.6% of the population growth in metropolitan areas with more than 1 million people took place in the core cities; the rest took place in the suburbs. That 8.6% represents a decline from the 1990s, when the figure was 15.4%. Nor are Americans abandoning their basic attraction for single-family dwellings or automobile commuting. Over the past decade, single-family houses grew far more than either multifamily or attached homes, accounting for nearly 80% of all the new households in the 51 largest cities.”
Certainly, the suburbs continue to grow in Seattle, contributing to demand for more freeway lanes. Dr. Richard Morrill, Professor Emeritus at the University of Washington in Seattle, writes in “Crosscut” –
“But the growth is not flooding back into the central cities. Ninety percent of metropolitan growth is in the suburbs, which are gaining higher shares of less affluent families, singles, couples, and empty-nesters. Seattle Mayor Greg Nickels’ goal of 350,000 more people in Seattle is not supported by demography or economic demand.”
This link from “Housing Bubble Bust” shows the nation’s fastest growing counties, from 2000-2009: http://www.housingbubblebust.com/PopHsgRates/Top100Counties.html
Smart Growth and Light Rail Proponents Never Touch the Air Pollution Problem
As congestion increases, air pollution increases dramatically, including CO2. However, smart growth and light rail proponents never discuss that transit only takes a few percent of all trips, yet congestion increases with time. Furthermore, the graphs below show that vehicles emit more air pollution in gridlock at slower speeds. Consequentially, air pollution continues to increase near major freeways that planners refuse to expand. This places children, pregnant women, and even men at risk for hardening of the arteries (see studies, below).

From: http://esa21.kennesaw.edu/activities/smog-cars/doe-veh-pollutants.pdf Accessed: Dec. 10, 2011
Caveat! Misleading Graph Above!
For many months, I have been looking for the best graphs on NOX, HC, CO, CO2, and VOC. The best one I can find is from the United Kingdom. I need to edit it on another Computer screen for this post, and convert it to English units.
You will note that the above graph is misleading, since they begin at 10mph. Of course, when idyling, or in stop and go traffic, emissions measured in grams per mile are much higher. The UK graph goes down to zero km/hr and shows this very clearly.
The UK graphs are at this address:
http://www.highways.gov.uk/knowledge/1801.aspx
CO2 Research from Dr. Matthew Barth at UC-Riverside
Dr. Matthew Barth studies how to smooth traffic flows to reduce carbon dioxide, a greenhouse gas. This graph (below) shows how CO2 levels increase dramatically below 30mph (in grams per mile).
Note: The steepness of the curve further increases between zero and ten mph. The same can be found for the British graphs for other pollutants, that I will post.
NO2 Research from the UK
The UK graph for NO2, that contributes to Ozone pollution and respiratory problems, appears following the CO2 graph below.
Even though NO2 increases at higher speeds, emissions at higher at near gridlock speeds, and when stopped at stop lights. Therefore, building more freeway lanes and timing stop lights is a priority, to fight the war on asthma and other respiratory diseases.
Light rail is not the answer since it will take only 1% to 3% of all trips in the Seattle area by 2040.

From: http://ti.org/congestion&GHGs.pdf Accessed December 10, 2011

From: http://www.highways.gov.uk/knowledge/1801.aspx Accessed: December 10, 2011
Click here for my air pollution photos in different cities, including Seattle and Bellevue.
Traffic Calming to Smooth Traffic Flow
Dr. William Barth studies methods to smooth traffic flow to reduce CO2 emissions. However, traffic calming to reduce stop and go traffic, such as on I-5 in Seattle below, can increase emissions, and Dr. Barth would certainly admit that the Puget Sound Regional Council is wrong, and that I-5 needs more freeway lanes.
The cars in this photo are going well under 40mph (they have their brake lights on, and within seconds, will be well under 10mph, and emitting huge levels of all five major auto generated pollutants). Therefore, again we see that building more freeway lanes is mandatory to fight air pollution; light rail is not enough.

Traffic calming in Seattle on I-5 increases emissions and reduces gas mileage. These cars have their brake lights on, and will soon travel at under 10mph.
Increasing Density with Smart Growth Increases Commute Times and Air Pollution
Dr. Wendell Cox studied 33 urbanized areas in the U.S. with over a million persons, along with 24 urbanized areas internationally. He found that “smart growth” densities (i.e. 5,000 and over) had longer commutes. Therefore, the plans for Seattle, Boulder, and Denver to increase density with “infilling” by way of smart growth towers, regional growth centers, and transit oriented developments, will ultimately increase air pollution.
This is yet another unresolved issue following the rejection of I-1125 by voters in the State of Washington. Except for a few web sites, the voters were not given scientific data on air pollution, bus rapid transit, and the health effects of air pollutants.
For Wendell Cox’s table of densities of U.S. metro areas, click here for my post on Kemper Freeman’s Engineering studies.

From: http://www.demographia.com/db-intljtwdens.htm Accessed: Dec. 10, 2011
Childhood Intelligence, Birth Weight, and Hardening of the Arteries from High Air Pollution
Recent studies link higher levels of air pollution to hardening of the arteries, decreased childhood intelligence, the onset of asthma, diminished fetal growth, and reduced birth weight (just like women who smoke during pregnancy). I will link to these studies.
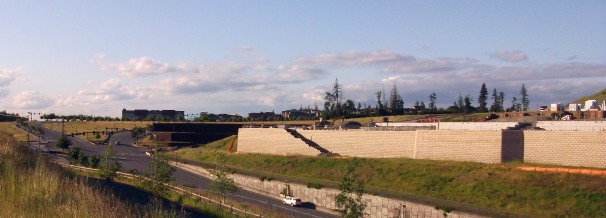
Therefore, low density development with larger lots and wider streets is “greener,” along with wider freeways with more lanes, with greenbelts and/or walls, such as this one along the US-97 bypass in Bend, Oregon (below).
Finally, until the transit unions, transit proponents, and smart growth advocates admit the facts about light rail, and preferences for suburbs, then the Seattle area will continue to waste billions of dollars on a system that will never take more than 3% of all vehicle trips in the Seattle area.
Tim Eyman Nov. 15, 2011 In Depth Demographic Info
PLEASE CLICK to enlarge within your web browser and read text.
